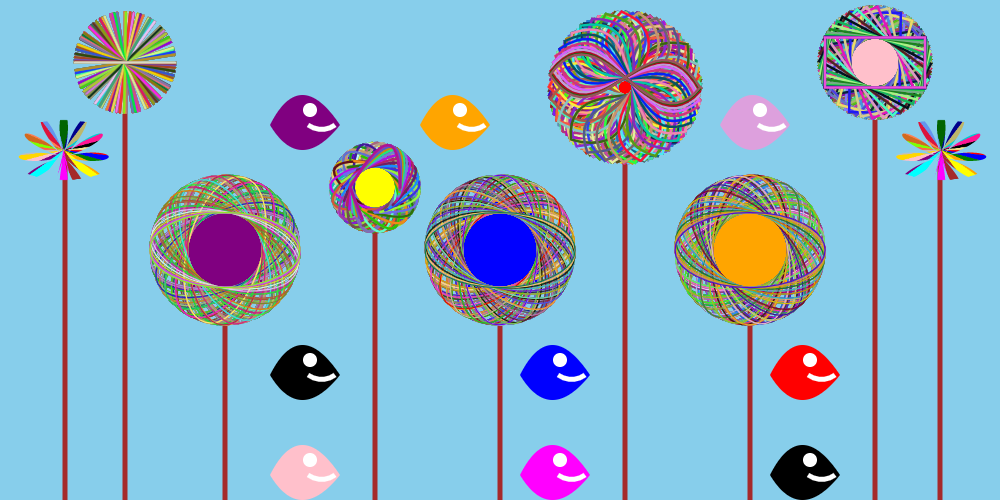
This was created by the HTML5 Canvas Element. I used the save and restore method and lots of for loops to create this image.
This was created by the HTML5 Canvas Element. I used the save and restore method and lots of for loops to create this image.


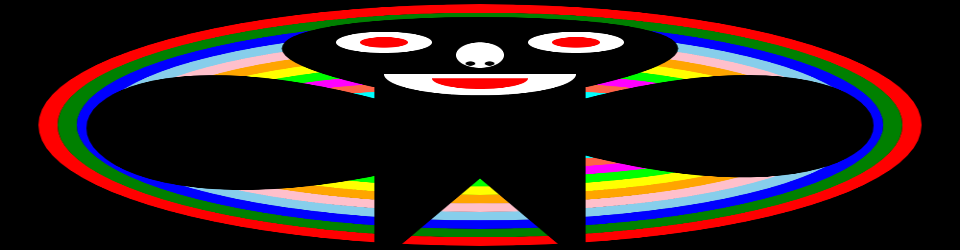
I Created this using JavaScript and HTML5 Canvas. The first thing I did was create an event listener. This loads the web page when the page loads. I then set the canvas to black and set up a function that creates polar curves. I used a for loop that created the polar curves. a complete circle was looped though I then created an array of different colors to change the color of each polar curve.
Here is the code that I used.


This is an Ellipse in HTML5 Canvas to create an Ellipse you have the starting x and y coordinates that’s in the middle of the radius. the you have the width and height. You can have an angle if you want one. Then you have the Start angle, End angle and the direction that it’s going which can be clockwise or counterclockwise. here is a video of the many ways an ellipse can be created


I went ahead and drew an arc in HTML5 CANVAS the canvas I used has a width of 1275px and a height of 590px. Pixels are a unit of measurement. Pixels are 1/96 of your computer screen. I used my full screen. To draw an arc, you pick an x coordinate and a y coordinate I choose the middle of my screen. Since I am using the canvas, my coordinates were canvas. Width and canvas. Height. You then pick a radius mine was 275px. then a starting angle and an ending angle after that you choose the direction you want it to go either clockwise or counterclockwise. I used many colors to create this arc and used different starting angles and end angles.


The way you draw lines in HTML5 CANVAS Is you chose a color a strokestyle then you begin a path you move to a point and then you line to a point then after that you stroke the line. You have two options the width of the line and the line Cap which can be square, butt or round. The image and the code are above.
I drew a Bezier Curve in HTML5 CANVAS!!! A Bezier Curve has a start point 2 control points and an end point. The control points determine how large the curve is. I added to 2 of the control points and subtracted 2 of the other control points when one reached a certain point all the control points went back to its starting value. I used the requestAnimationFrame to do this.
I drew a quadratic curve using the HTML5 Canvas Element. To draw a quadratic, you use a starting point, a control point and an end point. What I did was I used the request animation frame to change the value of the control point. When the control point hit a certain value, I changed the value of the starting point and then the ending point. I also used a counter variable to stop the animation when it hit a certain value.
I used the SVG element and the circle element to create this animation. I also used a combination of HTML, CSS and JAVASCRIPT. I set up an SVG element with a circle inside. I used some CSS style such as making the webpage black. I used JavaScript to make the circle bigger and to change colors. I set up a variable called r1 and added 20 to the radius. I then set up a timer to change the variable. When the variable became greater than 290 it converted back to twenty where it started. I also set up an array with colors inside and used a random number to change the color of the circle.


I finished a web page that used keyframe animations. I created a class called boxcars and put 4 divs inside them 2 divs were rectangular and the color blue. two divs I made round used the color white and then I used five divs for spokes. I positioned the two box cars and had the move across the page using keyframe animation.
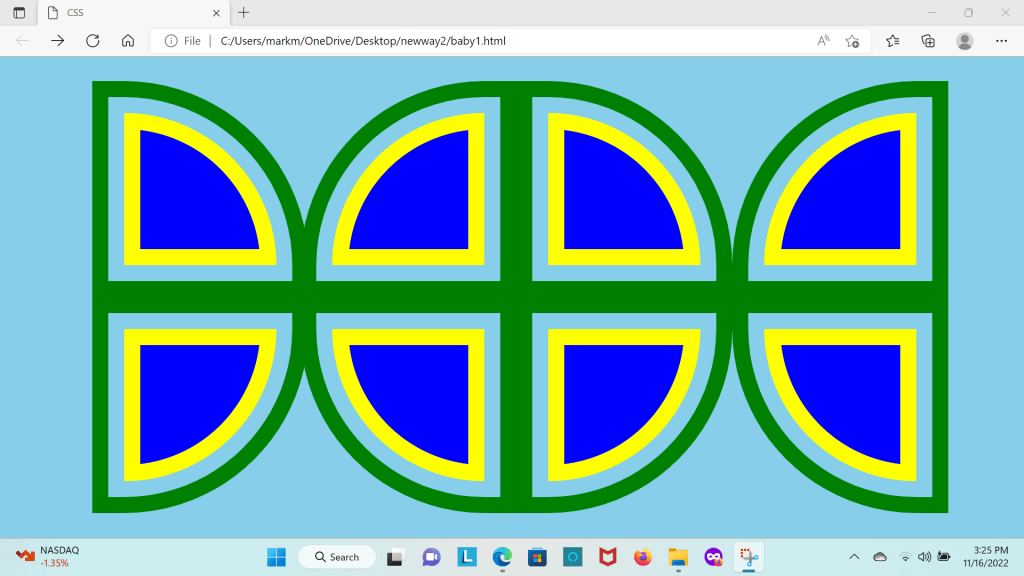
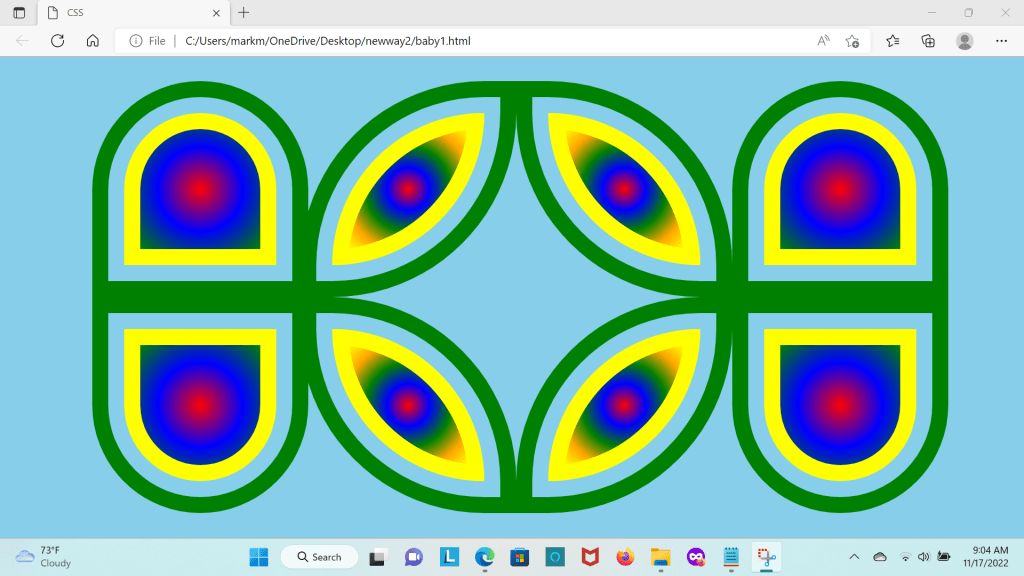
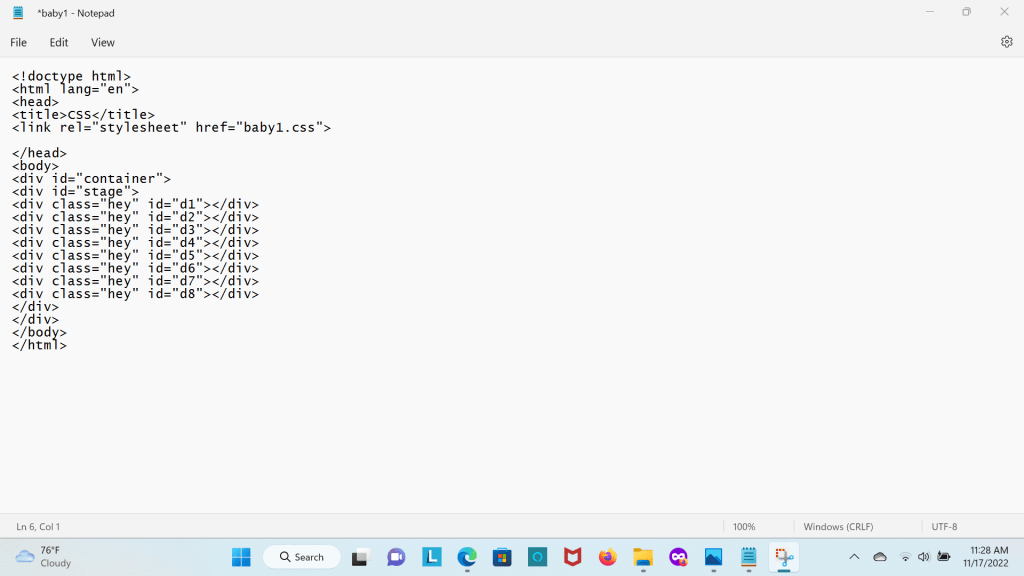
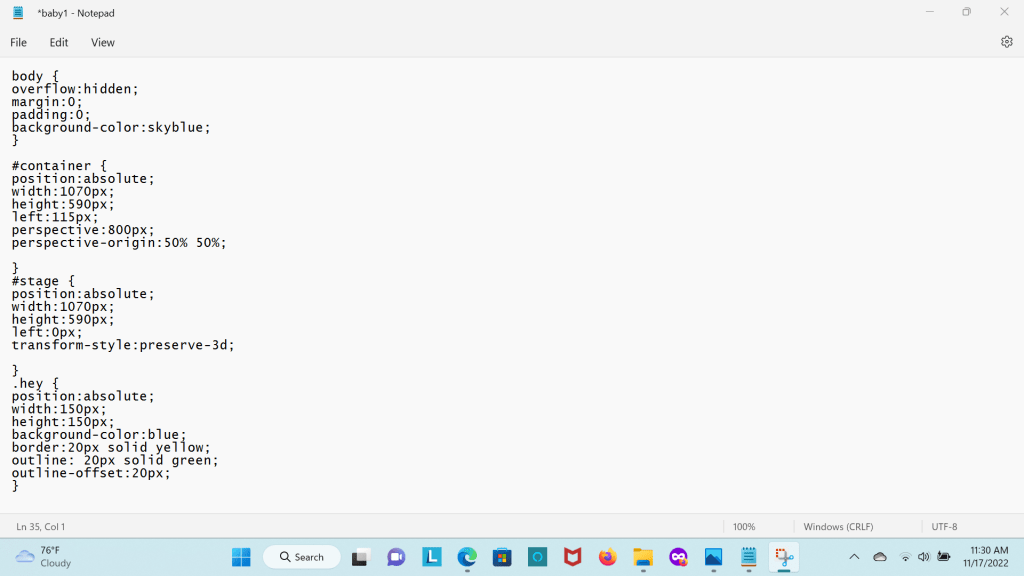
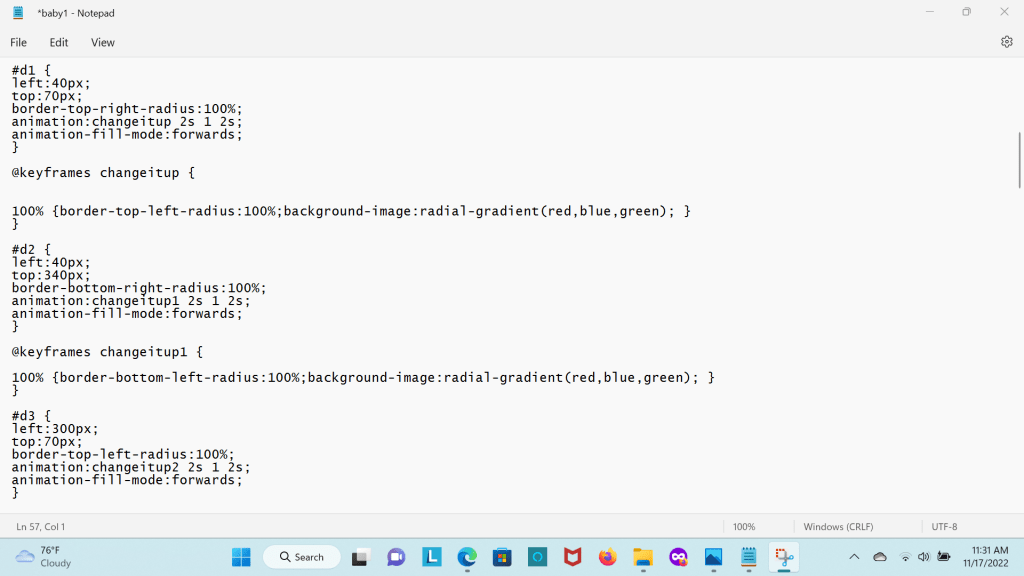
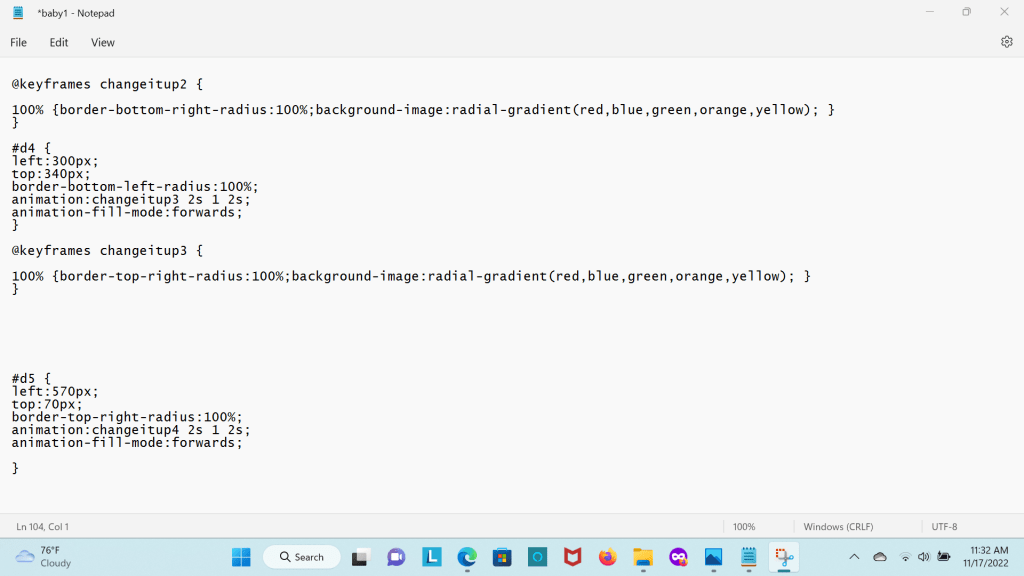
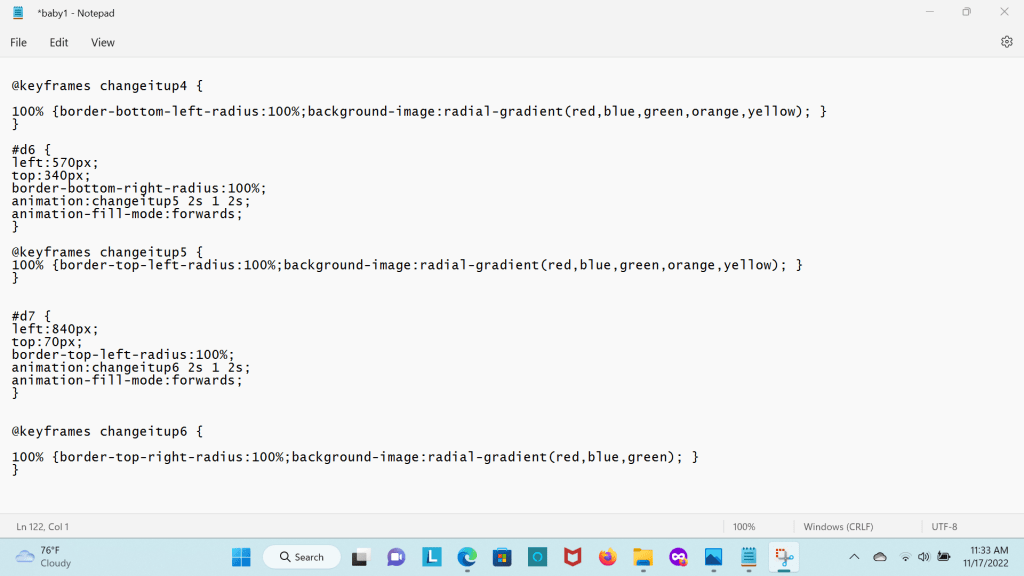
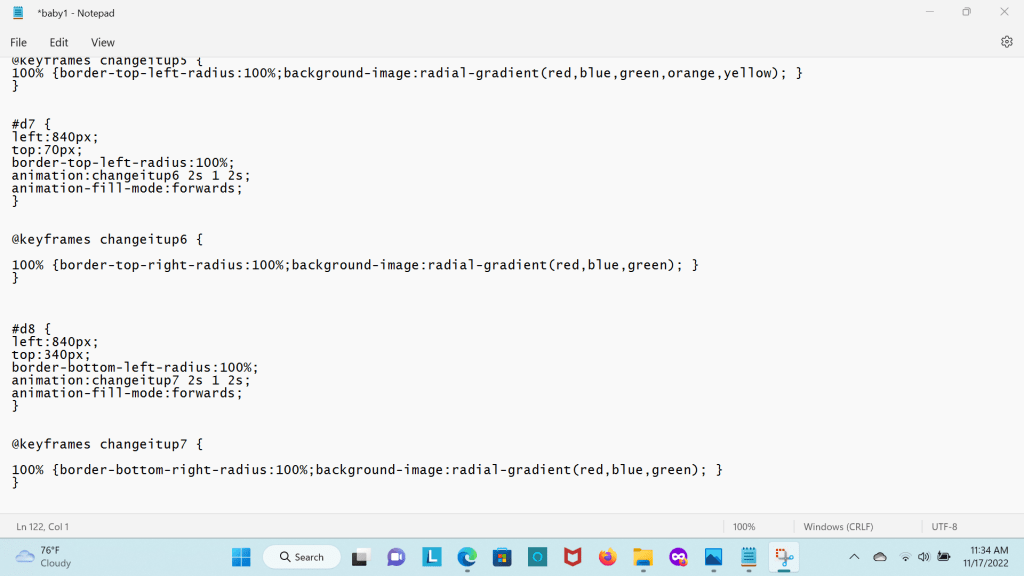
I used a webpage that is linked to a css page to create keyframe animations in css. I start out with a web page that has 8 div elements that are inside 2 other div elements that I do not use. I then create a class for the div that have similar properties. I position each div separately use a different border radius and use keyframe animations to change the page. Below is a short video of it.